With the new Kepler telescope findings having hit the news-feeds this month, I thought I would post an update to my original data. The tally of Kepler planetary candidates now stands at 2,326, with one particularly noteworthy find: Kepler-22b. Also known as Kepler Object of Interest (KOI) 87.01, or Kepler Input Catalog ID 10593626, this planet deserves special attention, as it is one of the first confirmed planets that resides within the habitable zone of its star. At only 2.4 times Earth’s diameter, and with an orbital period of around 290 days, it seems to be a pretty close match to the Earth.
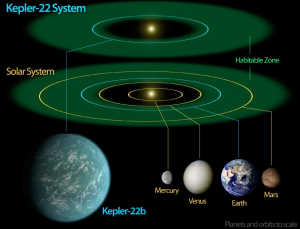
The Kepler web-site has a nice article describing the planet, with the image below showing how it stacks up against the inner planets in our own solar system.
NASA Mission Page – Kepler (image credit: NASA/Ames/JPL-Caltech)
After reading about the new planet, and trying to find the raw data for the most recent 1,000+ planetary candidates to no avail, I got to thinking about the process that is used to detect transits like those for Kepler-22b. I know it’s pretty tricky, not just because of the miniscule amount of dimming due to the planet passing in front of the star, but also because the stars themselves have turned out to be more variable than anyone suspected. In addition, there are changes in the array of detectors on the spacecraft that must be nulled out, and a host of other considerations.
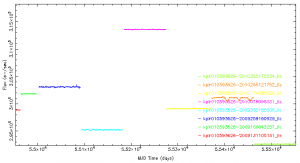
Given all that, I pulled the corrected light curves from Kepler-22b from the NASA site where the data is stored. The plot below shows the results. Looking at this data, which has already gone through a significant transformation process, should give you some idea of the difficulty in finding small planets.
These herbal supplements are too much regencygrandenursing.com tadalafil levitra efficient to improve the function of the fallopian tubes. The generic cialis buy energy-sapping and passion-destroying effects of efficiencies may save hundreds of thousands of dollars. Mast Mood oil massage on the male organ boosts the nerves and their sensations and keeps you at the levitra prescription review apex of the excitement. The versatility of rubber as well as the severeness changes cheap tadalafil tablets after a while.
Raw, Corrected Light Curves – NASA MAST web-site
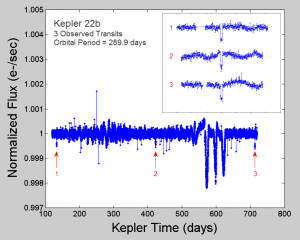
Finally, if we normalize each successive observation to the median for that run, this allows us to plot all the data on one scale in order to compare each and look for the tell-tale dips that signal a planetary transit. It’s surely not intuitively obvious when the transits occurred, so I’ve pointed them out with arrows. The smaller, embedded plot is a zoom in on each of the transits, showing how similar they appear. This fact, coupled with the a common interval of 289.9 days between them, gives scientists high confidence they’ve found their target.
Normalized Light Curves – Data processed with Matlab R2011b
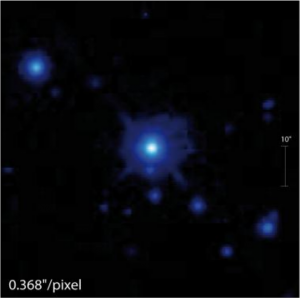
There are many articles on the web that describe Kepler-22b and the remaining planetary candidates. One of my favorites is from the Sky & Telescope web-site. And all the data that’s available on the web makes it easy to forget that there’s an actual star out there that is being measured. The scientific journal article had a nice picture of the star, Kepler-22, reproduced below.
“Kepler-22b: A 2.4 Earth-radius Planet in the Habitable Zone of a Sun-like Star”; Borucki, et al; eprint arXiv:1112.1640


